The Call Trace, is a stack trace of the calling function of the Linux Kernel.It will be output to log file, such as when the OS (Kernel) is hung up.
The stack trace is what function is shown how were being stack (which function calls which function).
Stack is that of data storage method of LIFO (Last IN First OUT).In the program, for example, call another function B from the function A in the program, it is the method for storing a memory address for returning to the function A after the end of the work function B.A memory area for storing a stack called the stack area.
The change of CPU and Memory while executing programs
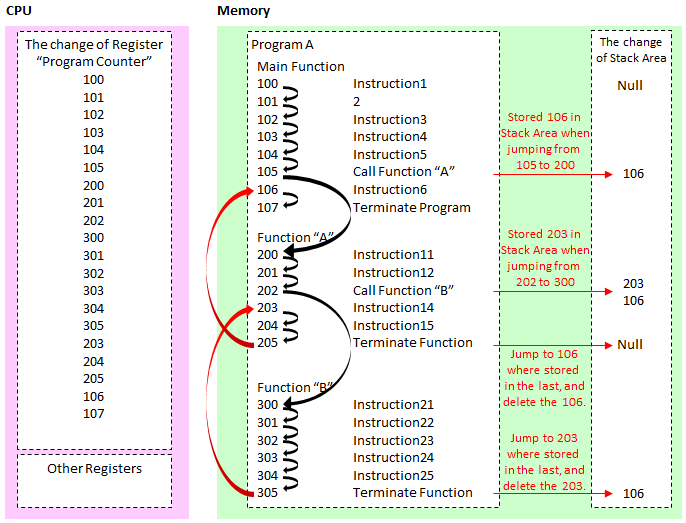
The program starts from the Main function, you can call one after another the various functions.Program "A" deployed on the memory as shown above in order to execute from the memory address 100, and sets the initial value of the CPU Register named program counter 100.
100 of "Instruction 1" is completed and the next step is to run the 101.It's over and the next to 102,,, and will continue to execute instructions in order.
But if the program call function on the way, then the instruction executed jump to the memory address that the function is deployed.In the above example, the next 105 will jump to the 200 which is the first of the memory address of the function A.But just jumping is no longer come back, so store the memory address "106" to be returned after the end of the function A in the stack area.
And jumps to the function A, it will continue to run in the same manner as in instruction, but we'll take you to or similar to function B in the middle.And to store the memory address "203" should go back to the stack area in the same way.At this time, the stack area are stored 203 and 106.
And although I get the function B the end of the memory address to be returned from the stack area, in accordance with LIFO at this time, to return to the last stored "203", remove the "203" from the stack area.
Then, after returning to the function A, also end function A, as well return to the "106" of the stack area, remove the "106".
Now I showed the flow, and back the story, Call Trace will be this way those dumping the state tracing the stack of function call.
How to read the Call Trace
For example, consider the case of the following Call Trace.
[4.679750] Call Trace:
[4.679774]  [<ffffffff812676b4>] dump_stack+0x44/0x55
[4.679803]  [<ffffffff81055434>] warn_slowpath_common+0x9a/0xb3
[4.679842]  [<ffffffffa005214f>] ? drm_wait_one_vblank+0x12c/0x145 [drm]
[4.679870]  [<ffffffff81055494>] warn_slowpath_fmt+0x47/0x49
[4.679896]  [<ffffffff81083c09>] ? finish_wait+0x57/0x60
[4.679935]  [<ffffffffa005214f>] drm_wait_one_vblank+0x12c/0x145 [drm]
[4.679959]  [<ffffffff81083d14>] ? wait_woken+0x70/0x70
[4.680041]  [<ffffffffa01e44ef>] intel_atomic_commit+0x403/0x526 [i915]
[4.680083]  [<ffffffffa00659fa>] drm_atomic_commit+0x48/0x4d [drm]
[4.680124]  [<ffffffffa00e411f>] restore_fbdev_mode+0xee/0x26c
[drm_kms_helper]
[4.680178]  [<ffffffffa00e5b35>]
drm_fb_helper_restore_fbdev_mode_unlocked+0x2b/0x6a [drm_kms_helper]
[4.680218]  [<ffffffffa00e5bae>] drm_fb_helper_set_par+0x3a/0x46
[drm_kms_helper]
[4.680295]  [<ffffffffa01fa9a2>] intel_fbdev_set_par+0x12/0x4f [i915]
[4.680320]  [<ffffffff812a9283>] fbcon_init+0x309/0x406
[4.680345]  [<ffffffff81314fd5>] visual_init+0xc8/0x11d
[4.680372]  [<ffffffff813166fc>] do_bind_con_driver+0x1ab/0x2cd
[4.680400]  [<ffffffff81316ae6>] do_take_over_console+0x142/0x172
[4.680427]  [<ffffffff812a8942>] do_fbcon_takeover+0x56/0x9a
[4.680457]  [<ffffffff812abe1e>] fbcon_event_notify+0x31c/0x644
[4.680484]  [<ffffffff8106cb08>] notifier_call_chain+0x37/0x59
[4.680517]  [<ffffffff8106cd5f>]
__blocking_notifier_call_chain+0x41/0x5a
[4.680549]  [<ffffffff8106cd87>] blocking_notifier_call_chain+0xf/0x11
[4.680577]  [<ffffffff812b0b0a>] fb_notifier_call_chain+0x16/0x18
[4.680606]  [<ffffffff812b282a>] register_framebuffer+0x26f/0x2a7
[4.680652]  [<ffffffffa00e5e66>]
drm_fb_helper_initial_config+0x2ac/0x321 [drm_kms_helper]
[4.680730]  [<ffffffffa01fb338>]
intel_fbdev_initial_config+0x16/0x18 [i915]
[4.680758]  [<ffffffff8106ddce>] async_run_entry_fn+0x34/0xbe
[4.680786]  [<ffffffff81067583>] process_one_work+0x1b2/0x327
[4.680812]  [<ffffffff81067e85>] worker_thread+0x277/0x36f
[4.680843]  [<ffffffff81067c0e>] ? cancel_delayed_work_sync+0x10/0x10
[4.680865]  [<ffffffff8106bf63>] kthread+0xcd/0xd5
[4.680895]  [<ffffffff8106be96>] ? kthread_create_on_node+0x15c/0x15c
[4.680921]  [<ffffffff814f801f>] ret_from_fork+0x3f/0x70
[4.680952]  [<ffffffff8106be96>] ? kthread_create_on_node+0x15c/0x15c
[4.680973] ---[ end trace f295b50a7b94aa26 ]---
The function of the origin is that the last of the "kthread_create_on_node", then it calls ret_from_fork, and it calls kthread_create_on_node, calls kthread ,,,.
The value of ffffffff8106be96 next on the left to function name is a memory address stored in the stack area.
In the second from the top "warn_slowpath_common" is no longer withstand, dumping the Call Trace by the last in "dump_stack", it seems.
IT/インフラエンジニアの地位とスキル向上のために


あなたが成長の日々を歩めますように。

コメント